Token Reflexivity
Reflexivity is the idea that prices affect fundamentals and that fundamentals, in turn, affect prices. It is widely suggested that the ETHUSD rate is reflexive. The logic is that an increase in the ETHUSD rate generates more interest in Ethereum, resulting in more fees and, thus, higher prices. A core component of this circularity is that fees on Ethereum are priced in ETH. As the ETHUSD rate rises, the fees in USD can also increase, further increasing the ETHUSD rate.

We can demonstrate the importance of reflexivity from the perspective of an investor who simplistically values the ETHUSD rate as the expected present discounted value of current and future income in USD1:
\[M_t = \sum_{i=0}^{n}{\frac{F_{t+n} + S_{t+n} + V_{t+n}}{(1+r_t+p_t-c_t)^{t+n}}} \tag{1}\]where $M_t$ is the market capitalization at block $t$, $F$ is fees, $S$ is seignorage, $V$ is MEV, $r$ is the risk-free rate, $p_t$ is a risk premium, and $c$ is a convenience yield, or more colloquially referred to as a monetary premium. Isolating fees, the log amount of fees paid in USD $f_{t}$ for inclusion and ordering in block $t$ is:
\[f_{t} = p_t+\mu_{eth,t}+g_t \tag{3}\]where $\mu_{eth}$ is the log weighted average gas price in ETH, $p_t$ is the log ETHUSD rate, and $g_t$ is the log amount of gas consumed. We can break this down further as:
\[f_t = p_t + \mu_{eth,t}+u_t+l_t \tag{4}\]where $u_t$ is network utilization, or $\frac{g_t}{l_t}$, and $l_t$ is the gas limit. Equations $(2)$ and $(3)$ show the potential circularity between the ETHUSD rate, fees, and gas consumption. We can express this as a function of $p$:
\[f_{t} = \alpha_{f,p}+\beta_{f,p}p_t \tag{5}\]Therefore:
\[f_{t} = \alpha_{\mu_{eth},p}+(\beta_{\mu_{eth},p}+1)p_t + \alpha_{u,p}+\beta_{u,p}p_t + \alpha_{l,p}+\beta_{l,p}p_t \tag{6}\]Simplified, assuming the gas limit $l_t$ is independent of $p_t$:
\[f_t = (\alpha_{\mu_{eth},p}+\alpha_{u,p}+\alpha_{l,p})+(\beta_{\mu_{eth},p}+1+\beta_{u,p})p_t \tag{7}\]Equivalently, using $g_t$:
\[f_t = (\alpha_{\mu_{eth},p}+\alpha_{g,p})+(\beta_{\mu_{eth},p}+1+\beta_{g,p})p_t \tag{8}\]Alternatively, viewed from the perspective of users who set their gas prices in USD:
\[f_t= \mu_{usd}+g_t \tag{9}\]where $\mu_{usd}$ is the weighted average gas price in USD. As a function of $p$:
\[f_t = (\alpha_{\mu_{usd},p}+\alpha_{g,p})+(\beta_{\mu_{usd},p}+\beta_{g,p})p_t \tag{10}\]Regardless of the empirical specification, if the following condition holds, after controlling for other factors, then the relationship between $f$ and $p$ is not reflexive:
\[\begin{aligned} (\beta_{\mu_{eth},p}+1+\beta_{g,p})= (\beta_{\mu_{eth},p}+1+\beta_{u,p})= (\beta_{\mu_{usd},p}+\beta_{g,p})= (\beta_{\mu_{usd},p}+\beta_{u,p})={0} \end{aligned} \tag{11}\]A negative value would imply a self-correcting feedback process towards some equilibrium. However, we are concerned with a positive value indicating an unstable, self-reinforcing process.
Ultimately, we need to determine whether the amount users are willing to pay in USD is set independently from the ETHUSD rate. The above analysis simplifies the problem since we have yet to consider the impact of other factors like MEV and the EIP-1559 burn mechanism. Nevertheless, it can be an illuminating framework with important implications for investors and protocol designers.
We use the block-level data published by Liu et al. (2022) to do some preliminary exploration. The data starts at block 12,895,000 and ends at block 13,104,999. The London hard fork, which incorporates EIP-1559, occurs at block 12,965,000. We have five dependent variables: block utilization $u_t$, gas used $g_t$, 5th percentile of ETH fees paid in a block $\mu_{eth,5}$ , 50th percentile of ETH fees paid in a block $\mu_{eth,50}$ , and 95th percentile of ETH fees paid in a block $\mu_{eth,95}$. Our independent variables are the ETHUSD rate $p_t$, block number, and a binary indicator for EIP-1559. All variables except the block number and EIP indicators are in logarithms.
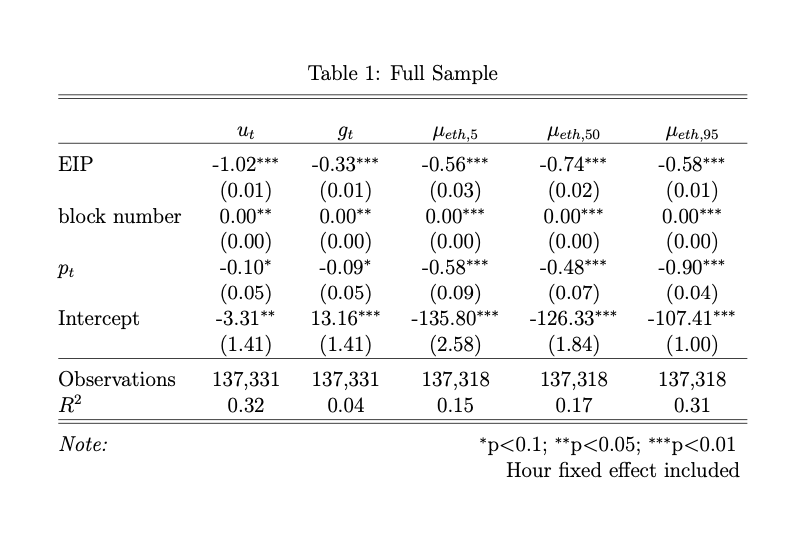
In Table 1, we see that $u_t$ and $g_t$ are negatively related to the ETHUSD rate. We also see that users do indeed take into account the USD value of fees as indicated by the significantly negative coefficients across $\mu_{eth}$ percentiles. In other words, when the ETHUSD rate is high, users lower their bids in ETH. These results imply the coefficient for aggregate fees paid in USD on $p_t$ is .32, .42, and 0 for the 5th, 50th, and 95th percentiles, respectively. The 5th and 10th percentiles are statistically significant, indicating reflexivity, but the 95th percentile is not.
More interestingly, we can split our sample into pre- and post-1559 to see how the results vary. Table 2 shows the results pre-1559 which is the period between block 12,895,000 (7/20/21) and 12,965,000 (8/5/2021).
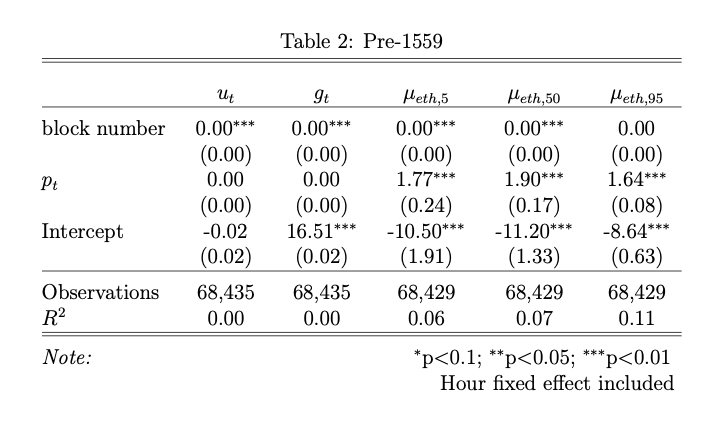
The results for $\mu_{eth}$ pre-1559 are significantly positive and greater than two in USD terms indicating a highly reflexive relationship to the ETHUSD rate. However, in Table 3 we see the results are significantly negative for $\mu_{eth}$ post-1559 between blocks 13,035,000 (8/16/21) and 13,105,000 (8/31/21).
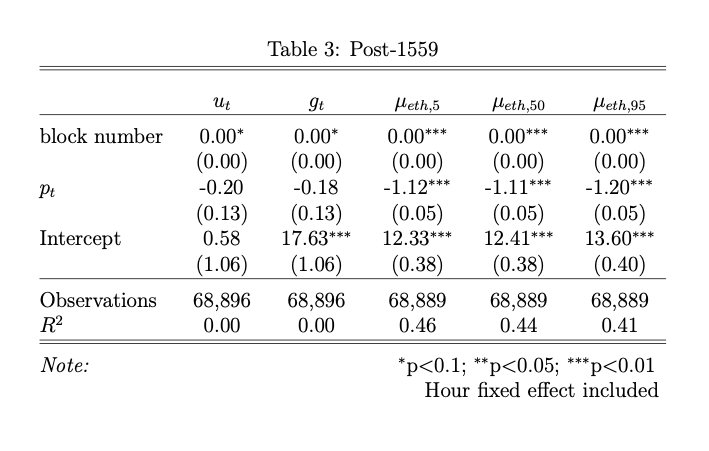
We need to think through the logical reason for this dichotomy more. Arguably, this analysis suffers from omitted variables bias, and I would agree. So, take the results with a grain of salt. However, users adjusting their bids in ETH lower in response to higher ETHUSD rates is consistent with the results of Liu et al. (2022) and Donmez and Karaivanov (2021). We should account for macroeconomic variables and time, since, presumably, they would meaningfully impact our results. With regard to time, we looked at block-level data here, but results may differ when aggregated across different time intervals. Also, take into consideration that we have only observed a month’s worth of data, hardly enough to draw sweeping conclusions. For example, the ETHUSD rate was up 58% during our pre-1559 period and up only 8% post-1559 which may responsible for the large pre-1559 coefficients.
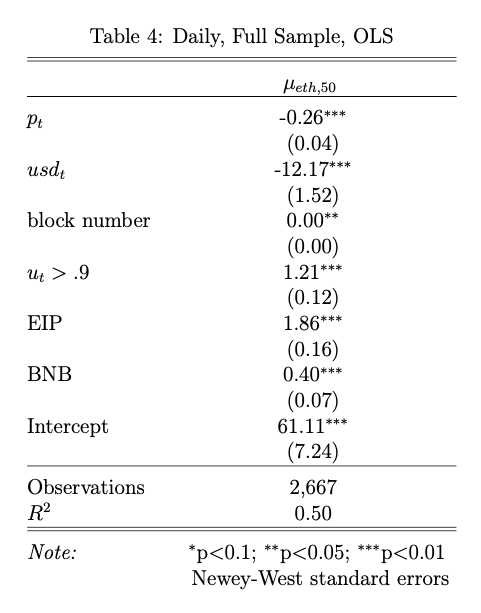
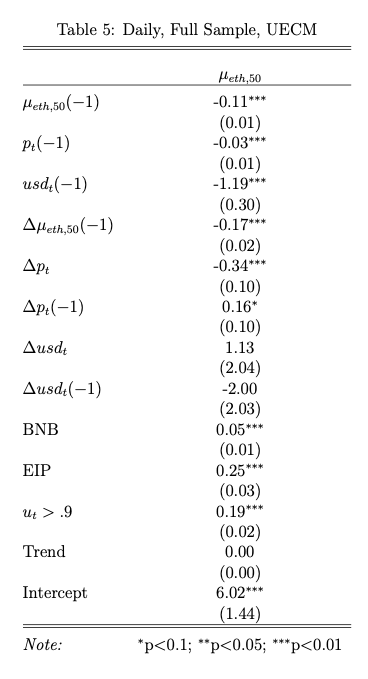
We can quickly apply a different model at a daily frequency including additional variables. Table 4 uses data aggregated at daily intervals where $usd_t$ is the DXY index level, $u_t > .9$ is a binary indicator when network utilization is greater than 90%, EIP is 0 before the introduction of EIP-1559 and 1 afterwards, and BNB is 1 when the ETHUSD price is above the 130-day moving average and 0 otherwise. We can see that $p_t$ and $usd_t$ have negative coefficients whereas high utilization and BNB have positive coefficients, all of which are significant using Newey-West standard errors.
We have been using a standard OLS specification, however, it may be more appropriate to use another model, particularly considering we are interested in potentially nonstationary variables. We may want to use an unconstrained error correction model (UECM). This would allow us to determine the effects of levels and first differences and, thus, long- versus short-term effects. Table 5 shows the results of a UECM with two lags using the variables from Table 4. Our results are similar to the OLS specification but there are additional diagnostic tests we need to run to determine the quality of the model.
Despite the shortcomings mentioned above, the formalization and analysis we have done here is a good starting point for further work.
-
Alternatively, we can use uncovered interest rate parity. ↩